Global Green Ammonia Market - Comprehensive Data-Driven Market Analysis & Strategic Outlook
The global green ammonia market was born from the idea of the scientists who were looking for cleaner alternatives to conventional ammonia production, which was heavily reliant on natural gas and resulted in the emission of large amounts of carbon. In the early 2000s, small research groups were investigating the possibility of using renewable electricity for the splitting of water into hydrogen and then converting that hydrogen into ammonia. The concept at that time seemed like a laboratory experiment and far from commercialization as renewable energy was still costly and inefficient.
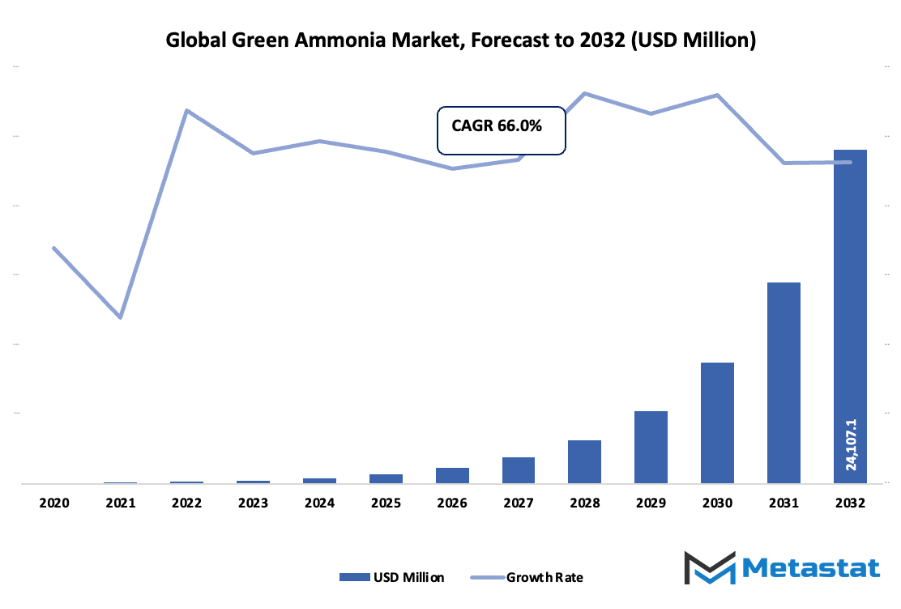
- The global green ammonia market is expected to be valued at around USD 693.9 million by 2025, and its growth rate is expected to be around 66.0% through 2032 with the possibility of surpassing USD 24107.1 million.
- Alkaline Water Electrolysis is anticipated to take the lion’s share of the market nearly 45.1% and encourages innovation and the development of new applications through intensive research.
- The main drivers of the market are: Increased demand for eco-friendly fertilizers and green hydrogen as a carrier.
- The future of the green ammonia market seems to be bright as far as the use of the product in maritime transport is concerned.
- The main point is: The market will experience a drastic increase in value during the coming ten years, thus presenting huge growth potentials.
The cost of wind and solar electricity had long been the bane of their adoption when turning point came. To regions with large renewable resources, such as parts of Europe and the Australian coasts, ammonia produced from clean electric power would sooner or later become a way of using electricity for shipping, storing, and fertilizing without adding carbon to the atmosphere. Slowly but surely, governments also noticed, and they opened up funding programs and even constructed pilot plants. The dawn of these milestones allowed energy giants to view the idea not only as a scientific curiosity but also as a future profit-making venture.
As climate commitments tightened in the mid-2010s, various industries began looking for ways to reduce emissions along their entire supply chain. Shipping companies were among the first to look at ammonia as a possible fuel because of its easy handling, storage, and transportation as compared to hydrogen gas. Farmers and agricultural buyers, who had previously considered only the price of fertilizers, started gradually demanding eco-friendly options alongside affordable ones. This quiet yet consistent buyer expectation change compelled the investors to look into the new production technologies.
The last few years have seen the combination of automation, digital monitoring, and high-efficiency electrolyzers create a rapid progress. The research teams that were focusing on reducing production energy were working alongside the engineering firms that were making safety systems and storage methods better. Regulatory authorities were taking clean-fuel mandates and giving low-carbon manufacturing incentives, thus, creating a more predictable business environment. The supply of the commercial path was strengthened by the cooperation of renewable energy producers, fertilizer manufacturers, and shipping fuel suppliers.
Today, the global green ammonia market is transitioning from experimental demonstration sites to large-scale facilities that will operate on offshore wind farms or solar-rich deserts. The journey from scientific idea to emerging industrial reality shows how shifting consumer expectations, supportive regulations, and continuous innovations will shape its direction in the years ahead.
Market Segments
The global green ammonia market is mainly classified based on Production Process, Capacity, End Use.
By Production Process is further segmented into:
- Alkaline Water Electrolysis: Alkaline Water Electrolysis tries to produce clean ammonia with the help of renewable electricity and water. This process first divides water and then hydrogen is reacted with nitrogen to produce ammonia. Researchers' and companies' strong interest leads to the gradual adoption of the method. A lot of research work demonstrates the contribution of this method to the decrease of emissions and hence the growth of the global green ammonia market.
- Proton Exchange Membrane: The Proton Exchange Membrane makes use of a solid electrolyte and renewable power to produce hydrogen with a very fast response to power fluctuations. This production method is seen as flexible and is thus particularly beneficial for areas where renewable energy is variable. The steady advances in equipment design are paving the way for more widespread use and supporting ammonia projects in achieving lower carbon production targets.
- Solid Oxide Electrolysis: Solid Oxide Electrolysis is dependent on high temperatures and ceramic materials to generate hydrogen at a very high efficiency. The process is highly compatible with the industrial zones where the waste heat is available. The higher temperature range helps in cutting down the power consumption during hydrogen production, which in turn, allows better energy management for the ammonia makers focusing on the cleaner production methods.
By Capacity the market is divided into:
- High: Facilities with high capacity support huge ammonia production which is then supplied to both the regions and the global market. Consequently, these facilities are often combined with large-scale renewable energy projects to ensure constant and reliable energy supply. The high capacity systems permit industries to have a steady rate of production that needs constant supply and this giving birth to long-term planning of ammonia production and distribution networks.
- Medium: Facilities with medium capacity deliver a balanced production for regional consumption. This level is chosen by many developers to lower their risk while at the same time proving the reliability of newer technologies. The medium scale output is suitable for the expanding markets that require clean ammonia but do not want to invest heavily upfront. Therefore, the producers gradually expand their operations, as they are using flexible production assets, seeking slow but steady progress.
- Low: Facilities with low capacity are the ones where the early testing and pilot-scale production take place. The research centers and smaller companies are the major ones that use this level to test the new technology. Low capacity production is often linked with innovation programs, which allows the easy modification of system design and hydrogen production parameters before shifting to large-scale industrial setups.
By End Use the market is further divided into:
- Fertilizer: Fertilizer production remains a major use of ammonia due to strong nutrient value for crops. Cleaner ammonia supports farming systems seeking lower emissions. Many agricultural groups explore renewable ammonia to meet future sustainability rules. Growing interest from farmers encourages steady demand for ammonia produced with cleaner methods.
- Transportation: Transportation projects focus on ammonia as a carrier for hydrogen or as a direct fuel for ships and large engines. Many research programs test new engines and fuel systems powered by ammonia. Cleaner ammonia fuels support lower emissions during long-distance routes, promising progress for sustainable transport goals.
- Power Generation: Power Generation uses ammonia as a storage method for renewable energy. Ammonia can be converted back into energy through burning or fuel cell systems. Power plants exploring cleaner fuel options track ammonia as an alternative that allows storage of excess wind or solar electricity for later use.
- Industrial Feedstock: Industrial Feedstock applications depend on ammonia for chemicals, plastics, and synthetic materials. Cleaner ammonia supports industries seeking lower emissions while maintaining steady production. Many business groups examine ammonia-based hydrogen as a replacement for fossil fuel hydrogen. This use encourages investment in cleaner production networks.
- Others: Other uses include refrigeration, research applications, and energy storage projects. Many new pilot projects explore ammonia for niche activities that benefit from compact fuel storage. Growing attention from technology developers supports ongoing testing. These projects help build knowledge for future large-scale ammonia systems and wider commercial adoption.
|
Forecast Period
|
2025-2032
|
|
Market Size in 2025
|
$693.9 Million
|
|
Market Size by 2032
|
$24107.1 Million
|
|
Growth Rate from 2025 to 2032
|
66.0%
|
|
Base Year
|
2024
|
|
Regions Covered
|
North America, Europe, Asia-Pacific, South America, Middle East & Africa
|
By Region:
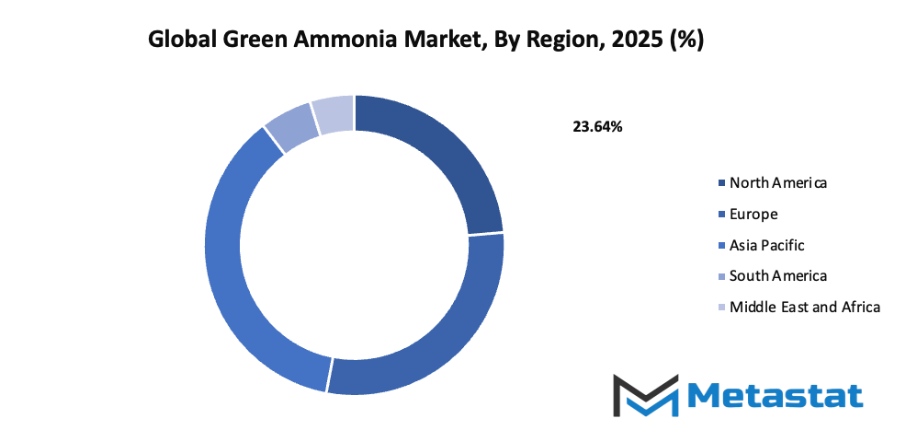
- Based on geography, the global green ammonia market is divided into North America, Europe, Asia-Pacific, South America, and the Middle East & Africa.
- North America is further divided into the U.S., Canada, and Mexico, whereas Europe consists of the UK, Germany, France, Italy, and the Rest of Europe.
- Asia-Pacific is segmented into India, China, Japan, South Korea, and the Rest of Asia-Pacific.
- The South America region includes Brazil, Argentina, and the Rest of South America, while the Middle East & Africa is categorized into GCC Countries, Egypt, South Africa, and the Rest of the Middle East & Africa.
Growth Drivers
- Rapid Decarbonization Initiatives Across Industrial and Energy Sectors:
Growing pressure to cut carbon emissions encourages industrial and energy sectors to shift toward cleaner production. Many countries set strict carbon reduction targets, supporting investment in green ammonia production. The global green ammonia market gains support as industries search for alternatives reducing pollution and meeting climate goals and new regulatory demands.
- Growing Demand for Sustainable Fertilizers and Green Hydrogen Carrier:
Agriculture needs fertilizers that lower environmental harm. Green ammonia offers a route toward clean fertilizer because production avoids fossil fuels and reduces harmful emissions. Green ammonia also functions as a carrier for hydrogen, allowing safer transport and storage for future clean energy use. Strong demand from farming boosts market interest.
Challenges
- High Production and Infrastructure Costs:
Development of green ammonia requires large financial investment. Production demands advanced equipment, renewable power, and strict safety systems. Many companies hesitate due to slow return on investment. High cost reduces large-scale adoption and slows growth of green ammonia projects across many regions, creating financial barriers for expansion and progress plans.
- Limited Availability of Renewable Energy Sources:
Green ammonia production needs strong access to renewable power. Many regions still lack stable solar or wind capacity, creating unpredictable output and limiting consistent production. Shortage of clean energy slows progress and prevents steady supply for wider adoption across industrial or agricultural sectors around the world and future growth potential.
Opportunities
- Expansion of Green Ammonia as a Fuel for Maritime Transport:
Shipping companies and port operators explore green ammonia as a cleaner fuel option. Green ammonia offers strong energy content without carbon emissions during use. Growing interest encourages investment in safe storage systems and fueling stations, supporting wider acceptance within global transport routes, leading to new commercial opportunities and economic momentum.
Competitive Landscape & Strategic Insights
Growing interest in sustainable energy solutions has opened new opportunities across the global green ammonia market. Demand for cleaner production methods has encouraged major corporations and regional ventures to invest in advanced technologies and large-scale infrastructure. The industry combines established multinational organizations with ambitious regional groups that seek a stronger presence. Each participant pursues efficiency, cost control, and environmental responsibility.
Several companies hold strong positions. CF Industries Holdings, Inc focuses on expanding low-carbon production by upgrading facilities and forming strategic partnerships. BASF SE uses strong research experience and strong capital to support innovation. Yara International ASA promotes cleaner agricultural practices through improved synthesis methods. Maire Tecnimont S.p.A. and ACME Group support major construction projects that accelerate new plant development. Fertiglobe plc and NEL Hydrogen concentrate on hydrogen production and distribution, forming a foundation for ammonia production using renewable energy. ThyssenKrupp AG, ENGIE, and Holder Topsoe push technical progress through engineering expertise. Iberdrola and Siemens AG contribute energy generation solutions, while Greenfield Nitrogen LLC and KAPSOM plc add new ideas through flexible project models.
Strong competition encourages lower costs and encourages better technology. Continuous improvement supports energy independence as more regions aim to reduce reliance on fossil fuels. Supportive policies and financial incentives from governments further motivate investment in modern plants and research. Collaboration among energy suppliers, technology developers, and industrial users shortens development time and reduces risk. The market benefits from shared knowledge and demand from sectors such as power, transportation, and farming.
Market size is forecast to rise from USD 693.9 million in 2025 to over USD 24107.1 million by 2032. Green Ammonia will maintain dominance but face growing competition from emerging formats.
Future progress will depend on reliable energy sources, adequate funding, and ongoing education. As production scales, equipment upgrades and improved logistics will guide supply growth. Cleaner practices support long-term economic gains while strengthening global efforts to reduce emissions. With committed investment and structured planning, the global green ammonia market will support a more sustainable future and prosperity.
Report Coverage
This research report categorizes the global green ammonia market based on various segments and regions, forecasts revenue growth, and analyzes trends in each submarket. The report analyses the key growth drivers, opportunities, and challenges influencing the global green ammonia market. Recent market developments and competitive strategies such as expansion, type launch, development, partnership, merger, and acquisition have been included to draw the competitive landscape in the market. The report strategically identifies and profiles the key market players and analyses their core competencies in each sub-segment of the global green ammonia market.
Green Ammonia Market Key Segments:
By Production Process
- Alkaline Water Electrolysis
- Proton Exchange Membrane
- Solid Oxide Electrolysis
By Capacity
By End Use
- Fertilizer
- Transportation
- Power Generation
- Industrial Feedstock
- Others
Key Global Green Ammonia Industry Players
WHAT REPORT PROVIDES
- Full in-depth analysis of the parent Industry
- Important changes in market and its dynamics
- Segmentation details of the market
- Former, on-going, and projected market analysis in terms of volume and value
- Assessment of niche industry developments
- Market share analysis
- Key strategies of major players
- Emerging segments and regional growth potential