

MARKET OVERVIEW
The Global Electronic Navigational Charts (ENC) market emerges as a crucial player, steering the course towards safer and more efficient sea journeys. Unlike traditional paper charts, electronic navigational charts have become indispensable tools, harnessing the power of cutting-edge technology to redefine the maritime industry.
In the Global ENC market there are electronic charts that seamlessly integrate with advanced navigation systems, offering mariners a real-time, digital representation of the surrounding waters. This technological shift has significantly enhanced navigational accuracy and situational awareness, mitigating the risks associated with maritime travel. The Mariners now rely on electronic charts for precise information on water depths, hazards, and navigational aids, ushering in a new era of reliability and efficiency.
The Global ENC market's significance extends beyond mere navigational aids, encompassing a comprehensive ecosystem of software, hardware, and services. Electronic charts, with their dynamic layers of information, provide a multifaceted view of the maritime environment, facilitating not only safe navigation but also efficient route planning and optimization. This comprehensive approach contributes to fuel efficiency, cost savings, and a reduced environmental impact, aligning with the industry's growing emphasis on sustainability.
Moreover, the Global ENC market has catalyzed the development of sophisticated Electronic Chart Display and Information Systems (ECDIS). These systems have become instrumental in revolutionizing bridge operations, enabling seamless integration of data from various sources. The integration of ENC data with real-time information such as weather conditions, traffic patterns, and port data empowers mariners to make informed decisions swiftly, fostering a safer and more streamlined navigation process.
As the maritime industry continues to evolve, the Global ENC market stands at the forefront of innovation, addressing the evolving needs of vessel operators, shipping companies, and regulatory bodies. The market's adaptability is evident in its embrace of emerging technologies such as artificial intelligence, machine learning, and data analytics, further enriching the capabilities of electronic charts and navigation systems.
The Global Electronic Navigational Charts market is not merely a collection of charts and software; it represents a transformative force shaping the future of maritime navigation. Its impact extends far beyond the immediate realm of charts, influencing the very fabric of how mariners navigate and manage their vessels. As the industry sails into uncharted waters, the Global ENC market stands as a beacon of innovation, guiding maritime stakeholders towards a safer, more efficient, and technologically advanced future.
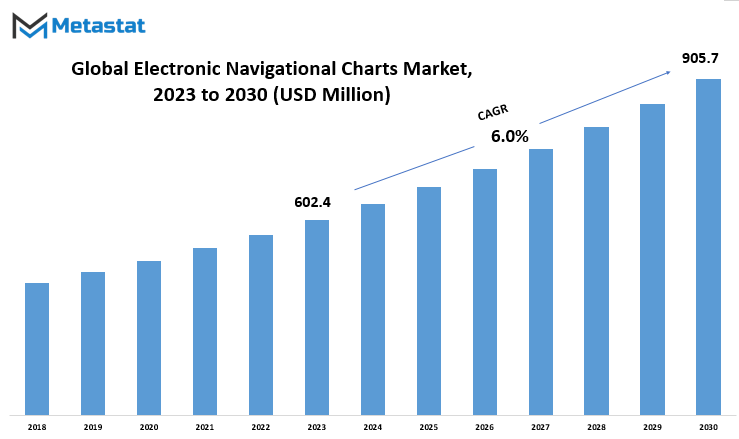
Global Electronic Navigational Charts market is estimated to reach $905.7 Million by 2030; growing at a CAGR of 6.0% from 2023 to 2030.
GROWTH FACTORS
The Global Electronic Navigational Charts (ENC) market is propelled forward by key driving factors that underscore its growth trajectory. These factors, often serving as catalysts, propel the market forward, contributing to its expansion and significance.
Yet, like any market, there exist certain challenges that might temper this growth. These hurdles, though not insurmountable, warrant consideration. They cast shadows on the otherwise optimistic landscape, reminding us that progress is not without its obstacles.
Amidst these challenges, there lies a silver lining. Opportunities, in various forms, await exploration and exploitation. These openings, if seized upon, can pave the way for the market's prosperity in the coming years. They represent promising avenues, beckoning towards a future where the market can not only overcome challenges but also thrive and flourish.
The Global Electronic Navigational Charts market is a dynamic entity, influenced by both propelling forces and inhibiting factors. While challenges exist, opportunities shine on the horizon, inviting the market to navigate through complexities and chart a course towards sustained growth. The market's journey, much like the seas it assists navigating, is marked by a constant ebb and flow, with the promise of discovery and advancement on the horizon.
MARKET SEGMENTATION
By Type
In the Global Electronic Navigational Charts market, a nuanced understanding of its types provides a clearer picture of its varied applications. The market can be dissected into distinct segments, each with its unique characteristics and applications.
The Vector segment, valued at 74.7 USD Million in 2022, represents a type of navigational chart that employs mathematical equations to define geographical features. It excels in offering precision and adaptability, making it a preferred choice in various navigational scenarios.
On the other hand, the Raster segment, valued at 54.8 USD Million in the same period, utilizes a grid of pixels to represent geographical data. While it may lack the mathematical precision of Vector charts, it excels in providing a visual representation that is easy to interpret, making it valuable in certain navigation contexts.
Moving on, the Inland segment, valued at 17.7 USD Million in 2022, caters specifically to inland waterways. Its design and features are tailored to the unique challenges and requirements of navigating rivers, canals, and other inland water routes.
The Bathymetric segment, valued at 12.8 USD Million in the same period, focuses on representing the underwater topography. This type of chart is crucial for activities such as deep-sea navigation, fishing, and scientific research.
ECDIS Based, valued at 393 USD Million in 2022, refers to charts designed for use with Electronic Chart Display and Information Systems. These charts, integral to modern navigation, provide real-time information and enhance situational awareness for maritime activities.
The PC Based segment, valued at 6.27 USD Million in 2022, signifies charts that are primarily accessed and utilized through personal computers. This type offers flexibility and ease of use, making it a convenient choice for certain navigational applications.
The Global Electronic Navigational Charts market, through its various types, caters to the diverse needs of navigation across different environments. From the precision of Vector charts to the visual clarity of Raster charts, and the specialized focus of Inland and Bathymetric charts, each type plays a crucial role in ensuring safe and effective navigation. The integration of ECDIS Based charts and the accessibility of PC Based charts further contribute to the market's adaptability to the evolving landscape of navigation technologies.

By Vessel Type
The segmentation by Vessel Type plays a pivotal role in discerning its varied applications. This segmentation adds a layer of specificity to the market, allowing for a more nuanced understanding of how electronic navigational charts are employed across diverse maritime scenarios.
Container Ships, as a vessel type, represent a significant user of electronic navigational charts. These ships, responsible for transporting goods across the seas, rely on precise navigation to ensure timely and secure deliveries. Similarly, Tankers, which transport liquid cargo, benefit from electronic charts to navigate safely through intricate waterways.
Bulk Carriers, another prominent vessel type, utilize electronic navigational charts to navigate efficiently while transporting large quantities of goods. In the passenger and tourism sector, Passenger and Cruise Ships leverage these charts to provide a smooth and secure journey for travelers, enhancing the overall experience.
Fishing vessels, operating in often challenging marine environments, utilize electronic navigational charts for accurate positioning, ensuring optimal fishing locations. Research vessels, crucial for marine exploration and scientific studies, employ these charts to navigate through various research sites efficiently.
The segment of Military and Defense Vessels is particularly noteworthy, underscoring the vital role of electronic navigational charts in ensuring the strategic positioning and movement of naval fleets. The application extends to various other vessel types collectively classified as 'Others,' showcasing the adaptability and versatility of electronic navigational charts across diverse maritime activities.
The segmentation by Vessel Type in the Global Electronic Navigational Charts market is not merely a categorization exercise but a practical delineation of how these charts is integral to the safe and efficient navigation of a spectrum of vessels. From cargo carriers to military fleets, electronic navigational charts serve as a linchpin in ensuring precise maritime navigation across various vessel types.
REGIONAL ANALYSIS
The global Electronic Navigational Charts (ENC) market exhibits a geographical division that provides insights into its widespread influence. Geographically, this market is categorized into North America and Europe, two significant players in the global economic landscape.
North America, with its advanced technological infrastructure and maritime industry, stands as a key contributor to the Electronic Navigational Charts market. The region's commitment to innovation and efficiency in navigation systems has propelled the demand for ENC, reflecting its integral role in ensuring precise and secure maritime operations.
In parallel, Europe, with its extensive coastline and bustling maritime activities, also significantly influences the global ENC market. European nations, with a rich maritime history, recognize the importance of advanced navigation tools. The integration of ENC in this region aligns with the broader goal of enhancing maritime safety and efficiency.
Both North America and Europe share a common thread in recognizing the paramount significance of Electronic Navigational Charts in modern navigation systems. These charts, driven by technological advancements, have become instrumental in ensuring accurate and reliable navigation, reducing the risk of maritime incidents and optimizing overall operational efficiency.
As the global ENC market continues to evolve, the contributions from these key geographical players underscore the universal recognition of the need for advanced navigation solutions. The integration of Electronic Navigational Charts in these regions not only reflects their commitment to maritime safety but also sets a precedent for other regions to follow suit in adopting state-of-the-art navigation technologies.
COMPETITIVE PLAYERS
In the Global Electronic Navigational Charts (ENC) market, key players wield significant influence, contributing to the industry's growth and innovation. Among these key contributors are Maryland Nautical and Lloyd's Register OneOcean, both playing vital roles in shaping the trajectory of the Electronic Navigational Charts industry.
Maryland Nautical brings its expertise to the forefront, leveraging its position as a key player in the ENC market. Through its offerings and strategic initiatives, Maryland Nautical contributes to the development and accessibility of electronic navigational solutions. The company's presence resonates in the industry, impacting the way navigational information is processed and utilized.
Similarly, Lloyd's Register OneOcean stands as a noteworthy participant in the Electronic Navigational Charts sector. With a focus on technological advancements and a commitment to maritime safety, Lloyd's Register OneOcean plays a pivotal role in driving innovation within the industry. The company's contributions extend beyond routine navigation, influencing the broader landscape of electronic navigational solutions.
Together, these key players exemplify the dynamism within the Global Electronic Navigational Charts market. Their activities, innovations, and strategic approaches collectively shape the direction of the industry. As technology continues to advance, and the demand for precise and efficient navigational tools persists, the roles of companies like Maryland Nautical and Lloyd's Register OneOcean become increasingly integral, underscoring their significance in the evolving landscape of electronic navigation.
Electronic Navigational Charts Market Key Segments:
By Type
- Vector
- Raster
- Inland
- Bathymetric
- ECDIS Based
- PC Based
By Vessel Type
- Container Ships
- Tankers
- Bulk Carriers
- Passenger and Cruise Ships
- Fishing
- Research
- Military and Defense Vessels
- Others
Key Global Electronic Navigational Charts Industry Players
- Maryland Nautical
- Lloyd's Register OneOcean
- Wärtsilä Corporation
- Caim Scrl
- OceanWise Limited
- Poseidon Navigation Services Ltd.
- Japan Hydrographic Charts and Publications Co., Ltd
- Boeing (Jeppesen)
- American Nautical Services, Inc.
- StormGeo
- Fontanski Marine Supply
WHAT REPORT PROVIDES
- Full in-depth analysis of the parent Industry
- Important changes in market and its dynamics
- Segmentation details of the market
- Former, on-going, and projected market analysis in terms of volume and value
- Assessment of niche industry developments
- Market share analysis
- Key strategies of major players
- Emerging segments and regional growth potential


 US: +1 3023308252


